 By Will Psomadelis, Head of Trading; Australia,
Global Head of Electronic Strategy Research, Schroders
Trading is an integral part of the investment management process. Anyone that has ever constructed a portfolio strategy knows the extreme joy of discovering a pocket of alpha that we can’t believe hasn’t been exploited only to be faced with the immense frustration that transaction costs can erode it away.
It is also the almost the perfect case study of where quantitative inferences can;
1. successfully augment trader knowledge for some trading decisions;
2. be ignored due to inadequate data, excessive variance or during event trades where human intuition is important;
3. replace the human where the human would generally be unable to recognise patterns either due to speed or where multiple factors with complex relationships are driving the outcome.
There has never been a better time for traders to bring research in-house and exploit their own ideas using their own proprietary information, in the search for alpha vs. relying on third-party vendors. Trading not undertaken intelligently is actually
a tremendous source of alpha to other firms looking for it.
Maybe it’s human nature, but the industry has a long history of taking somewhat sensible ideas, and over time, distorting the outcomes such that they barely reflect the original intention. Take the VWAP algorithm, for example. What started out as a simple validation of how an order was executed against a possible range of prices was turned into a widely accepted, yet gameable, benchmark. This spawned a race by the sell-side to provide an algorithm that produces a near-deterministic signal that dominated the industry for a decade (and still does in some regions, despite better alternatives). Much time has been dedicated to this topic across the industry, including our own organisation (‘Ignorance is not bliss’, Schroders, 2018, ‘Know thy counterparty’, Schroders, 2013).
Transaction Cost Analysis (TCA) and the Algo Wheel are, independently, incredibly useful, however, there is a risk that they suffer the same fate if neither achieves their objective, being improved portfolio returns.
TCA is a very broad area of study that covers everything from individual fill analysis of execu- tion strategies to parent order costs that are the culmination of every decision taken in the life of an order. The challenge is to use this data on a systematic basis to improve the decision process and create measurable value.
The Algo Wheel is a necessary innovation to collect an exploration data sample of orders with reduced human bias. This data should be used to create improved routing decisions and therefore execution outcomes. The risk of the Algo Wheel is when the line is blurred between the exploration mechanism and the exploitation router.
There is a need to understand and critically evaluate the direction of industry research within the context of our own investment and trading objectives. Schroders has deployed an internally-designed product named QTRMASTER© to provide a Recommendation/ Routing solution to the trading team. This model relies on extending traditional TCA research to improve order timing and, using Algo Wheel data, to improve algorithm strategy selection.
Continuous investment in the area of execution research is crucial in a competitive landscape, QTRMASTER being a key expression of this.
UNDERSTANDING ORDER TIMING TO IMPROVE OUTCOMES (TCA VS. CONTEXTUAL TRADING ANALYSIS)
Implementation Shortfall (IS) is the attempt to align the trader’s objective in the hope of producing commercial-grade portfolios that can exist beyond an academic paper.
Whilst IS does provide the necessary data to capture the realised cost to the portfolio of execution, it fails to apply any context and therefore fails as a systematic feedback mechanism to the desk.
The grim reality is that traders are hostage to the prices available in the market within a sensible volume window of the order time (we measure periods up to 50 times the volume of the order). For a given order, these prices could be explained by:
• natural variation in the market where for longer duration orders we would expect the variance to increase;
• excessive signal leakage where a consistent reversion profile could be observed; or
• by the alpha decay of the strategy itself when price patterns appear regular.
Knowing this at order arrival can influence decisions taken throughout the order life.
“Contextual Trading Analysis” (CTA) was designed by Schroders and sits within QTRMASTER. The aim of CTA is to infer the value added from trader timing and produce statistics that can be provided to the trader for each new order. Simulations of every order executed across the group allow us to understand the return profile of historic orders for a given set of conditions, including portfolio strategy, and establish potential cost improvements through varying aggression levels. A series of adjustments are made to normalise for differences across strategies.
Traders are ultimately provided with the probability that an order being traded at one aggression level will have a better outcome than an order being traded in another. The trader/algorithm can use this initial belief and update it with real-time information to dynamically adjust aggression.
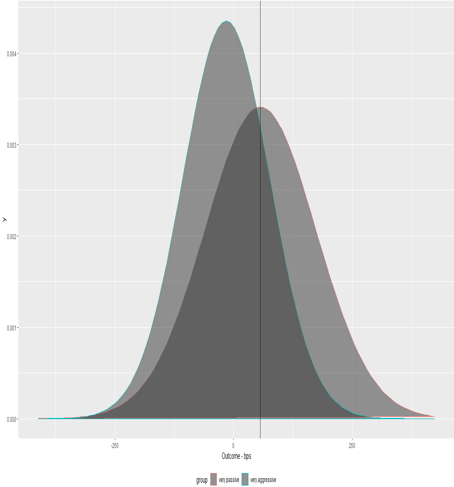
The example below shows the potential improvement curves for 2 individual fund groups as well as the variance (shaded) across each simulation.
Looking at the density plot below for a particular order type, QTRMASTER provides the trader with an estimation that an extremely passive strategy has a ~68.5% probability of providing a better outcome than trading in an extremely aggressive strategy. The alpha decay curve on the right for the same order type shows the potential improvements from executing across various strategies. Against the same estimated cost, an order executed extremely passively could achieve 50bpt improvement vs 20bpt worse if traded extremely aggressively.
This order type has a slow alpha decay profile for this fund indicating there is no initial requirement for immediacy. (IMAGE 1A)

Using the combination of generally accepted trading cost metrics (IS) and our own Contextual Trading Analytics, we are able to push parent order TCA into 2 studies. Firstly, raw Implementation Shortfall is incredibly useful to determine the cost to the portfolio of execution. Secondly, CTA closes the feedback mechanism by providing context as to the genesis of those slippage costs. CTA also provides some insight as to how a trader can amend order timing to potentially improve them going forward.
APPLYING FORECASTING TO IMPROVE STRATEGY SELECTION (THE ALGO WHEEL)
The global nature of our trading desk is such that Execution research centralised in Australia can be distributed to our global desks ensuring the same (or similar) models are used across the group, harmonising execution philosophy. This centralised research function is augmented by a group of global traders, experts in their own regions, who ultimately determine the selection of strategies in each Algo Wheel implementation.
In a world of infinite orders, there would be no issue constructing datasets that reflected evenly distributed order types across all execution strategies. In reality, we are constrained with an order budget to obtain meaningful data. The randomised Algo Wheel is deployed within QTRMASTER to overcome this constraint.
The wheel is tasked to create a balanced dataset across strategies, ensuring a relatively even distribution of orders across different variables/features and removing human bias. This ensures that certain brokers/strategy results are not skewed by the order types they receive. This balanced dataset is used to train a Random Forest Regression model that is at the core of our intelligent routing model. Cross-validation is deployed to address overfitting. This framework has been in place since 2016 with a global rollout occurring as markets became suitable. The research however, is an ongoing process.
We do not believe in ranking algorithms or issuing scorecards on aggregate datasets through the use of averages across arbitrary bins in single dimension models. Such a methodology ignores the sensitivity of the strategy to other factors.
Using univariate analysis, especially on arbitrary bins, seems to be a confusing legacy of history. With techniques easily available to properly group orders (clustering, CART etc), relying on arbitrary bins has 2 main deficiencies:
• The outcome (cost) of an order is dependent on many variables. ADV is generally the largest driver but factors such as spread, embedded alpha, and time of day and market cap also contribute amongst others; and
• Discretising continuous variables at arbitrary intervals ignores a significant amount of information that could improve the forecasts.
The arguments against ranking algorithms on aggregate datasets also highlights why the all too common question of “What is the best algorithm?” is futile and why QTRMASTER attempts to answer the question of “What is the best predicted outcome for each algorithm for an order with a specific set of features?”
QTRMASTER preserves a clear distinction between the Algo Wheel randomiser used to explore data, and a router based on the outcomes of a Random Forest model which is designed to exploit the lessons learned. By applying weights based on recent performance alone to the randomiser, which seems to be a popular technique, distributions between strategies may no longer be equal. The issue of an unbalanced data that the algo wheel attempts to nullify is somewhat re-injected into the dataset.
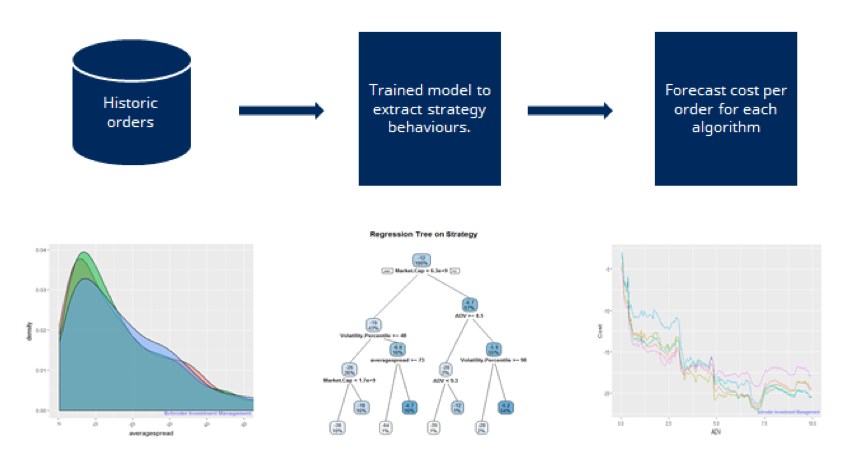
For QTRMASTER to route orders, it is necessary to understand the behaviours of each strategy relative to the range of variables or order features. Each new order is decomposed into its underlying features that will contribute most to the cost with the strategy selected being the one that can improve returns across the variables of each order. The flow of data is presented in IMAGE 1B.
Unfortunately, machine learning has become an overused and over-hyped term in finance in recent times. Machine learning within QTRMASTER had to be a last resort after trying other more traditional statistical models to ensure the data was understood and that complexity wasn’t being added to the process for no gain.
One common complaint of machine learning models is the “black box” nature of what happens within them. In the case of linear regression, considerable insight can be gained into the structure of the model by simply viewing the coefficients. There is no such neat output for machine learning, so alternative techniques have been designed to observe how the underlying model is likely to route orders and how each algorithm responds to each variable in isolation. (IMAGE 1C)
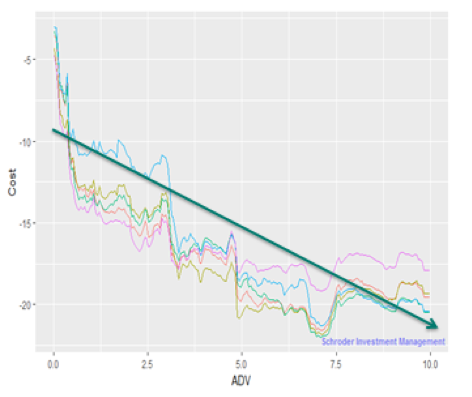
Using Partial Dependence Plots (above), we can observe the cost response (y-axis) to an individual variable, in this case, the size of the order measured as a percent of the ADV (x-axis). The colours represent the cost responses for each execution strategy. Order size has a complex relationship to cost well beyond linear (green line) which is not a dissimilar finding to our investigation into the industry accepted transaction cost models.
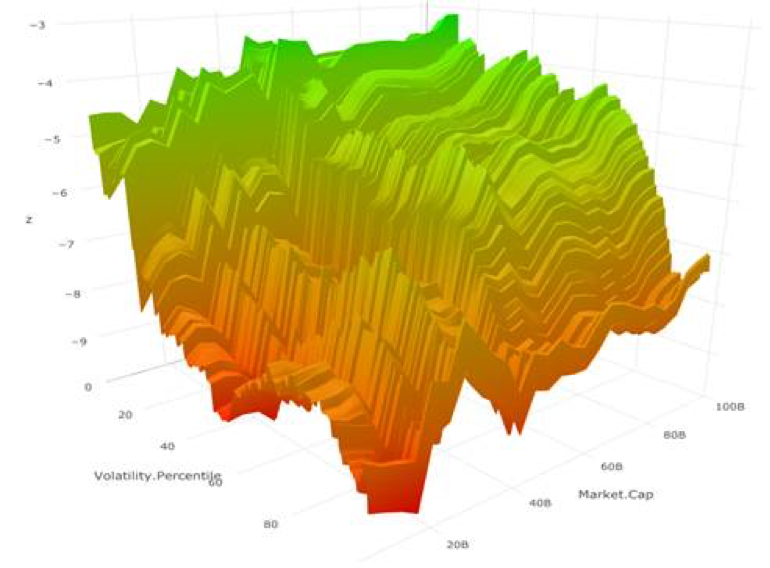
Some of the effects of individual order features are individually strong whilst others are only strong due to interaction effects. Variable interactions can arise when the effect of one variable on order outcome differs depending on the level of other variables.
The surface plot below, for example, shows the how market cap interacts with volatility. The interaction is demonstrated by a observing a larger effect on outcome (z) between volatility on smaller market cap stocks than larger ones. (IMAGE 1D)
Even with increasingly sophisticated techniques, it remains that the most important step in any research is to understand the data and domain and construct a robust process that questions the outcomes. Complexity should not be added for complexity’s sake.
Disclaimer: Opinions, estimates and projections in this article constitute the current judgement of the author as of the date of this article. They do not necessarily reflect the opinions of Schroder Investment Management Australia Limited, ABN 22 000 443 274, AFS Licence 226473 (“Schroders”) or any member of the Schroders Group and are subject to change without notice. In preparing this article, we have relied upon and assumed, without independent verification, the accuracy and completeness of all information available from public sources or which was otherwise reviewed by us. Schroders does not give any warranty as to the accuracy, reliability or completeness of information which is contained in this article. Except insofar as liability under any statute cannot be excluded, Schroders and its directors, employees, consultants or any company in the Schroders Group do not accept any liability (whether arising in contract, in tort or negligence or otherwise) for any error or omission in this article or for any resulting loss or damage (whether direct, indirect, consequential or otherwise) suffered by the recipient of this article or any other person. This document does not contain, and should not be relied on as containing, any investment, accounting, legal or tax advice. Schroders may record and monitor telephone calls for security, training and compliance purposes. ©2019 Schroders plc. All rights reserved. All copyright and other intellectual property rights in QTRMASTER is and remains the property of Schroders plc and its subsidiaries.
