Nasdaq’s Phil Mackintosh recently examined a single chart that combines many of the things he’s recently been discussing regarding market fragmentation, routing, spreads and ETF liquidity.
What he found is just how differently popular ETFs trade versus thinly-traded ETFs.
Smaller ETFs trade differently than large ETFs
In Chart 1 (see below), each circle represents an ETF ticker. Note that the biggest ETFs (big circles) also see the most trading (in the bottom right corner). That in turn results in the most competitive, and tightest spreads (low on the vertical axis). So far no surprises for regular readers of our posts.
However, where this chart gets interesting is the color scheme. Yellow circles represent stocks that trade on-exchange more than the market wide average. While the darker the circles get, the higher the proportion of trading that occurs off-exchange.
What that highlights is that for many thinly traded ETFs, the proportion of trading off-exchange is very high. There are a couple of good reasons for this.
First, the underlying investors are different. Hyper-liquid ETFs are frequently used by hedge funds and banks to hedge and take tactical positions. That’s why their turnover often looks more like a future than a stock. This in turn creates economies of scale for market-makers and arbitrageurs, even leading to tighter quotes and more tactical trading.
In fact, their spreads become so tight that they are usually much cheaper to trade than the underlying stocks.
In contrast, many of the smaller ETFs are designed for longer-term investors with active or smart beta portfolios. That in turn makes them more popular with retail and investment advisors. As we noted recently, advisors and retail investors tend to trade much more off-exchange.
We’d prefer to see tighter spreads on exchange and made some proposals to deliver this in our ETF Rule Comment. But until that happens, off-exchange trading of thinly traded ETFs can often help reduce trading costs, as we discuss below.
Chart 1: As ETF popularity increases, spreads fall and exchange trading increases
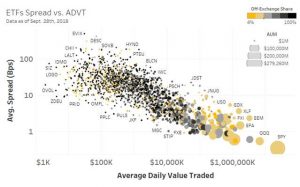
Source: Nasdaq Economic Research
Don’t be scared by ETFs with wider spreads and low ADVT
One of the unique things about ETFs is that market-makers can buy the ETF or buy the basket and do a creation. That’s important because it means, for larger trades:
ETF daily volume is NOT important, as arbitrageurs and market makers can pull liquidity from the underlying stocks into any ETF. That means most ETFs can easily absorb trades of at least $100m, which (for perspective) is roughly the market-wide value on offer in the U.S. market at any time during the day
ETF spreads should NOT deter investors from considering larger trades in an ETF, as market makers can buy the underlying stocks and convert that cost to an ETF
However, by definition, when you trade through a market maker you contribute to increased “off-exchange” trading.
Even if your trade is small, crossing the ETF spread is usually still cheaper than buying the basket of underlying stocks. In fact our data shows that more than 99.4% of ETF liquidity (by U.S. dollar value) trades with spreads less than 20bps.
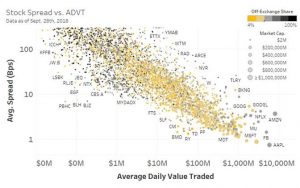
Bonus Chart: What about Stocks?
In case you’re wondering what this looks like for stocks, we’ve added that chart below too.
What we see is interesting: stocks trade more “the same” with many stocks being a pale shade of yellow (slightly more lit trading than the market-wide average). Although we do still see spreads are tighter as daily increases (diagonal slope of the line).
Thinly traded stocks (left side of chart) do tend to trade more dark, the pattern is nowhere near as strong as for ETFs—nor does it start at the same point:
ETFs trading less than $20 million/day tend to commonly trade a high percentage off-exchange
While stocks trading less than $1 million/day sometimes trade a little more off-exchange than average
One factor that is likely contributing to both stocks and ETFs is that retail internalization is a higher proportion of trading in smaller-cap securities.
Chart 2: The same chart looks very difference for corporate securities
More from Economic Research
Three Charts that dispel the Price Improvement Myth
The views and opinions expressed herein are the views and opinions of the author and do not necessarily reflect those of Nasdaq, Inc.
