By Phil Mackintosh, Senior Economist, Nasdaq

ETFs have been one of the success stories of modern markets. Trading around $100 billion per day with a weighted average spread of just 1.7 cents or 2.1 basis points (bps) at the start of the year. Overall, ETFs track their net asset value (NAV) extremely well, allowing investors and traders cheap access to diversified baskets and thematic exposures.
Let’s dive deeper into the data on how ETFs trade for five fun facts on ETFs you might not know.
- ETF turnover has declined
As the ETF industry matured it has seen some key developments:
- More Active ETFs: With the creation of thematic, then smart beta, then active, and now the approval of active non-transparent (ANT) ETFs, the traditional gap between ETFs and classic mutual funds has closed.
- Longer hold times: As that has happened, the holding times of the average investor has climbed and new ETF investors are more likely to use ETFs for long-term investing.
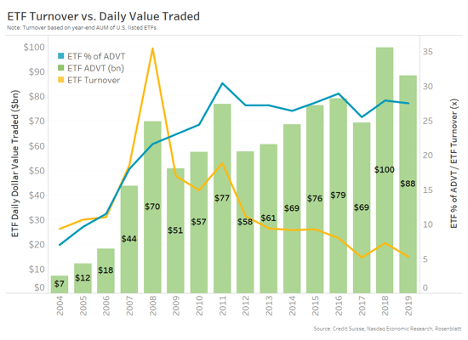
We can see this by looking at turnover (ETF trading per year/AUM, yellow line in Chart 1, and also in Chart 3 here).
Even though ETF trading and liquidity has significantly increased since 2004, the turnover has actually declined. ETFs remain much more of a trading vehicle than classic mutual funds—with turnover around 5x per year.
That shouldn’t be confused with the roughly 0.3x per year that mutual funds turn over the stocks in their portfolio, as most ETF portfolios likely trade less than their tickers too, especially index ETFs where portfolio turnover (before creations and redemptions) is typically under 0.1x per year.
It’s also interesting to see that despite the spike in ETF turnover during the credit crisis, the proportion that ETFs comprised of total market trading didn’t spike (blue line) as stock trading increased during the credit crisis.
Chart 1: Average daily ETF liquidity and turnover (AUM traded per year)
- ETFs have tighter spreads than stocks
We’ve shown for company shares that liquidity is a major determinant of a stocks spread.
The same holds true for ETFs (Chart 2). But data shows that ETFs typically have even tighter spreads than stocks with the same liquidity.
Chart 2: ETF spreads are lower than stocks of comparable liquidity
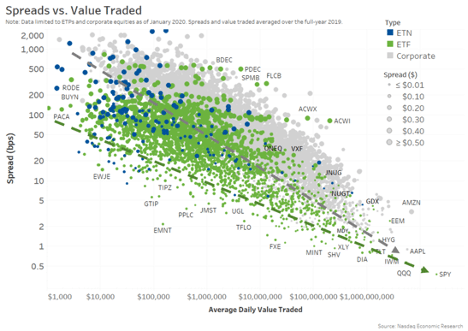
There are good reasons for that. For a start, an ETF represents a portfolio of stocks with their own underlying liquidity and spreads. Often the liquidity of the portfolio is multiples of the liquidity of the ETF.
In fact studies have found that almost no ETF trades anywhere near as much as its underlying portfolio. That’s even true of the most liquid ETFs:
- The most liquid ETF (SPY) trades $22 billion per day, but holds stocks that trade closer to $170 billion per day.
- The next most liquid ETF, QQQ, actually trades less than AAPL or AMZN, two of its largest holdings.
- Very few ETFs are priced over $100 per share
Of course, Chart 2 reminds us of the work we have done on the perfect stock price and the need for stock splits for corporates. There are now 228 S&P500 companies, or 45%, with prices over $100. Those “high priced” companies often trade with spreads multiple ticks wide and with odd lots providing the true BBO most of the time.
However, ETFs are different!
Data shows that only 8% of ETFs are priced over $100 per share. Importantly, the average liquidity of those ETFs is $403 million per day so most of those ETFs actually have the liquidity to support tight spreads and high prices. That can be seen by the small circles (spread in cents) in Chart 2.
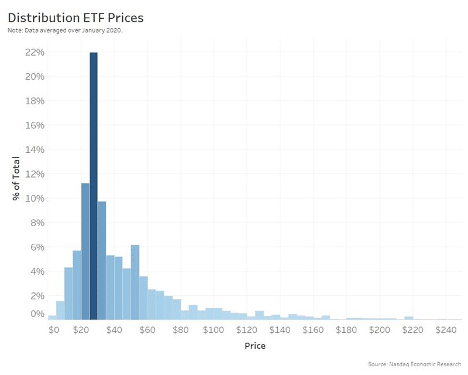
In fact, around half of all ETFs are priced in the trading “sweet spot”, between $20 and $50 per share, where one tick represents 2 bps to 5bps. That is enough to attract quotes, but not so large as to deter trading.
That’s not surprising given one of the primary functions of ETF issuers is to minimize trading costs and provide liquidity; it seems ETF issuers already know on how important tradability is.
Chart 3: The majority of ETFs are around $25 per share, priced for tradability
- Creations and redemptions are a small fraction of stock trading
Although ETFs are consistently 25% of market-wide value traded, it’s misleading to say ETFs cause stocks to trade anywhere near that much.
That’s partly because many ETFs actually track bonds or international stocks or commodities. But it’s also because ETFs have much tighter spreads than their underlying portfolio of stocks (Chart 2). In fact some studies have found that ETF prices are usually so much cheaper than trading the underlying basket that stock arbitrage (selling the ETF and buying stocks, or vice-versa) is unprofitable. That’s especially true for the most liquid ETFs which (as Chart 2 shows) have the tightest spreads.
Another way to show this is to look at creations and redemptions each day.
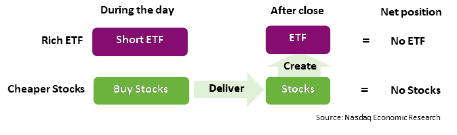
Creations and redemptions usually occur when liquidity providers have bought (or sold) the underlying stocks to hedge their ETF trades, whether with clients or because the ETF was rich (or cheap) enough to arbitrage. A creation allows the market maker to send their long stock position to the issuer and receive new ETF shares in return. That neutralizes the arbitrage position, eliminating inventory costs on an arbitrage; or the ETF can be delivered to directly the customer cheaper than the ETF was trading.
Chart 4a: ETF creations allow a market maker to exchange hedged stock positions with the issuer for new ETF shares which also reduces their net inventory (net position)
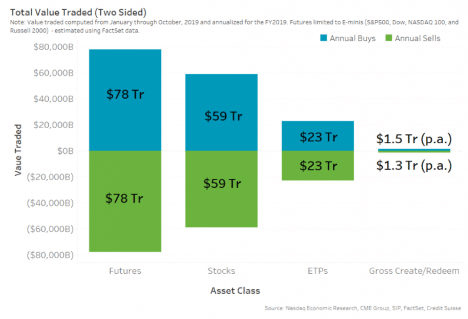
Each year creations and redemptions amount to roughly $2.8 trillion per annum. That sounds like a lot, but over a year it’s just 3% of U.S. stock trading, which adds to around $59 trillion of buying and selling each year.
Why focus on buying and selling? Despite the growth from net inflows to ETFs, creations and redemptions are close to equal. That means some reflect stock buying while others reflect stock selling. So it’s more correct to compare ETF creations and redemptions to the gross buying and selling of stocks, which adds to almost $120 trillion each year.
Chart 4b: ETF creations (and redemptions) are a fraction of ETF buying (and selling), and even less of gross stock or futures trading
- Different ETFs are used for different things
Retail investors, banks and hedge funds are all active users of ETFs. That’s testament to their cheap spreads and deep liquidity and close tracking vs. net asset value thanks to efficient arbitrage. But a deep dive shows that some ETFs are better suited to hedge funds while others are preferred by individual investors.
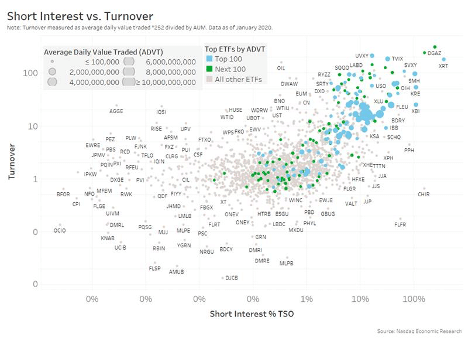
Chart 5 reveals the following about short interest (as a percentage of AUM) and turnover:
- Most ETF have relatively low short interest and turnover close to 1x.
- But around 100 ETFs have much higher turnover and also tend to have more short interest (the blue dots making the hockey-stick shape of chart 5). Although these ETFs represent just 4% of all tickers they make up 85% of all ETF liquidity. Those ETFs tend to offer thematic and index exposures. They act like futures providing predictable factor exposure for low costs.
Hedge funds and banks are the majority of investors doing short selling (thereby creating short interest). Not surprisingly, they prefer very liquid, often very cheap to trade, ETFs. They also tend to hold them for shorter-term thematic exposures, increasing their turnover.
Other ETFs that have higher proportion of retail participation and often more complex portfolio construction sometimes including more dynamic stock picking. That includes many of the smart beta and more active ETFs better designed for longer-term holding and outperformance, as Chart 3 here also shows.
Chart 5: Some ETFs have much higher turnover and short interest than others
What does this all mean?
One of the great features of ETFs is how well they work for so many investors.
That’s a testament to their cheap spreads and deep liquidity and close tracking vs. net asset value, which itself is thanks to efficient arbitrage and the creation and redemption process.
But just because ETFs trade a lot, doesn’t mean they make underlying stocks trade. There are enough buyers and sellers of many ETFs that they don’t trade in a “stock arbitrage” zone much at all.
That’s something the trading data also supports.
Five Surprising ETF Facts was originally published by Nasdaq.
