There is one thing still missing from the data debate — and that’s data.
The author of a recent op-ed in Canada made the comment that “rise in data fees has …a significant bearing on …net investment returns.”
That’s a big claim, sadly without any supporting calculations, which is symptomatic of much of the current data debate.
But let’s try to use the data that’s available to take a top-down look at investor costs and see how this claim stacks up.
How big are mutual funds?
Before we get into cost math, we need to understand how big mutual funds are, and how much they trade.
ICI data shows that equity mutual funds represent 52% of the $17 trillion in U.S. mutual fund assets, or $9.5 trillion. They also report that mutual fund turnover has fallen to just 32% (per side). That equates to trading of $5.9 trillion per year (buys and sells).
In contrast, the whole U.S. equity market trades $70 trillion per year. That’s $140 trillion(buys and sells).
Although it seems hard to believe, this puts mutual fund trading at less than 5% of market-wide activity. That’s in line with some estimates of retail trading.
What are the different costs to investors?
Let’s first be clear: The results below don’t suggest costs are “bad” for investors. Managing investments is not cost free; even those low priced index funds need a portfolio manager, custodian and accountants to calculate year-end distributions. For those investing with an advisor, it pays to ensure you save sensibly and have a secure retirement. And with a reported $27 trillion invested in U.S. equities directly and via mutual funds (see below), simple math means small charges can add to large notional values.
When thinking about costs, we look at five major types of costs: Investment Advisors, Mutual Fund Expenses (MER), Trading Impact, and Commissions and Regulatory (SEC and FINRA fees). To address the claim above, we also look at Exchange costs and costs for the Securities Information Processor, which we highlight are bundled into MER and Commissions.
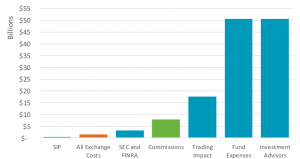
Looking at all of these, it certainly puts exchange costs in context, and hopefully encourages a more data-driven debate. Even looking at grossed up costs (Chart 1), Exchange and SEC fees are a small part of the total equation. This is especially noteworthy considering the important role of exchanges in bringing companies to market, regulating the market and supervising trading, which provides the returns that help secure the retirement of U.S. workers.
When allocated based on turnover (below), the inherent cost or impact on investor’s returns is even smaller.
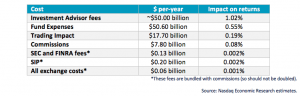
Chart 1: Estimated total revenues and investor costs across U.S. equities
Not all the data for this chart is freely available. Here is how we estimate it:
Management Expenses are probably the largest cost to investors. ICI reports average expense ratios have fallen to 0.55% in 2018. Based on other ICI data that suggest U.S. equity mutual funds are $9.2 trillion, which adds more than $50 billion in costs to investors.
Note that management expenses usually include things like SIP data costs, EMS and terminal costs, although soft-dollar agreements may pay these out of commissions. For completeness, industry-wide professional SIP user costs total around $0.2 billion per year.
Investment Advisor fees: Other data shows households hold more stock in their own account ($17 trillion) than mutual fund holdings. However, these investors often also pay an investment advisor to assist them manage their assets. Data on industry revenues from U.S. equities is hard to find, but typical fees are reportedly around 1% per-annum on assets, so revenues could easily be the around the same as the cost of managing mutual funds: $50 billion.
Market Impact costs: There is established literature about the fact that that trading causes market impact, with a Transaction Cost Analysis (TCA) industry that has developed to measure and manage it. It’s simple economics really. Buying (or selling) large quantities of a stock adds to demand (or supply) which moves prices up (or down), sometimes permanently. Interestingly, it’s generally reported that impact costs have been falling for decades. Recent ITG estimates imply average shortfall costs in the U.S. of 30 basis points (bps) per trade. We’d highlight that’s lower than any other country ITG measures, which speaks to how well the U.S. market works. But even then, on $5.9 trillion of trading, that adds up to almost $18 billion.
U.S. Equity Commissions were reported recently by Greenwich Associates at $7.4 billion. Equity commissions are “bundled,” and include a number of other expenses including net exchange fees, broker technology costs, settlement costs and even research.
SEC fees: SEC fees are reportedly around $2.3 billion and FINRA also charges brokers around $1 billion per year. Allocating these costs across the industry by value traded (see below) results in a cost to mutual funds of around $0.13 billion, which is also a rounding error on investor returns.
It is also possible to estimate some of the components that are included in the $7.4 billion of bundled U.S. Equity commissions.
The same Greenwich Associates study estimated around $4 billion of commissions was for research, or roughly around 50%.
Extrapolating our own study, all-in-exchange costs look to be around $1.5 billion. However based on trading levels below, the allocation to mutual funds would be less than $0.065 billion. The rest is incurred by other participants, from hedge funds to arbitrageurs and proprietary traders.
How much do those costs affect investor returns?
So, back to the original question: How much do these costs affect investor returns?
Remember that ICI data showed U.S. mutual fund assets are around $9.2 trillion. Also remember that for “industry-wide” costs, allocations to investors will be less than 5% based on their contribution to value traded (see * in table below). Doing some simple math, Table 1 shows the estimated impact on returns from each of the investor costs we’ve discussed.
Table 1: Estimated impact of costs on investors returns